01 · The brief
A request, a stack of spreadsheets, and a question.
My manager forwarded a request from the content, SEO, and eCommerce team (one group
at Ruggable, three hats). They had Excel sheets, one per category, dozens of rows
each, listing every page on the site. URLs, indexability, monthly searches, click
data, backlinks. What they couldn't do was see structure. Which pages were similar.
Which were duplicates. Which categories were swollen and which were thin. They were
trying to organize and simplify the site, and the only tool they had was a
spreadsheet that didn't show shape.
The ask was vague: "can we have a way to visualize the pages?" The scope was mine.
02 · The shape it needed
Cards over rows. Drag-and-drop. Multi-user.
A spreadsheet flattens hierarchy and forces sequential reading. A sitemap is the
opposite: structure at a glance, levels you can scan, parts you can move around. The
shape that fit the problem was card-based — homepage at the top, categories beneath,
subcategories nested under those, individual pages as draggable units that could move
within or across categories.
A few things had to come along:
- Per-page SEO context (searches, clicks, backlinks, indexability) surfaced where the page lived, not in a separate sheet.
- Drag-and-drop reorganization, because the whole point was to see and rearrange.
- Multi-user editing, because multiple people on the team would touch it from different angles.
- Version history, so a wrong drag didn't destroy a week of work.
- US and UK as separate datasets, because Ruggable runs both as distinct catalogs.
03 · The build
Figma Make for the surface. Supabase for the spine.
I designed and built the app solo. Figma Make was the build partner
for the front end, the way Claude was for Grounded. I wrote the spec, prompted my way
through the components, and let the AI generate the implementation I'd otherwise have
to engineer from scratch. I'm a designer, not a software engineer; the AI made it
possible to ship a real tool, not a prototype.
The backend ran on Supabase, with Realtime channels for live sync and edge functions
for data operations. React DnD handled the drag layer. React Router carried the
region-specific URLs and a dev-mode route for safe experimentation. The full stack
was honest about what I am: a designer who used AI to build the thing the team needed.
Figma Make
React
React DnD
React Router
Supabase (DB + Realtime)
Edge Functions
Vercel
LocalStorage
From my '24 EOY review
"Built a Visual Site Map for the eCommerce team using AI prompting, turning a small
internal request into a widely-used cross-functional planning tool praised by
leadership."
04 · The surface
What the tool actually does.
Six capability groups carry the bulk of the work. None of them are clever on their
own; together they're the difference between a spreadsheet and a sitemap.
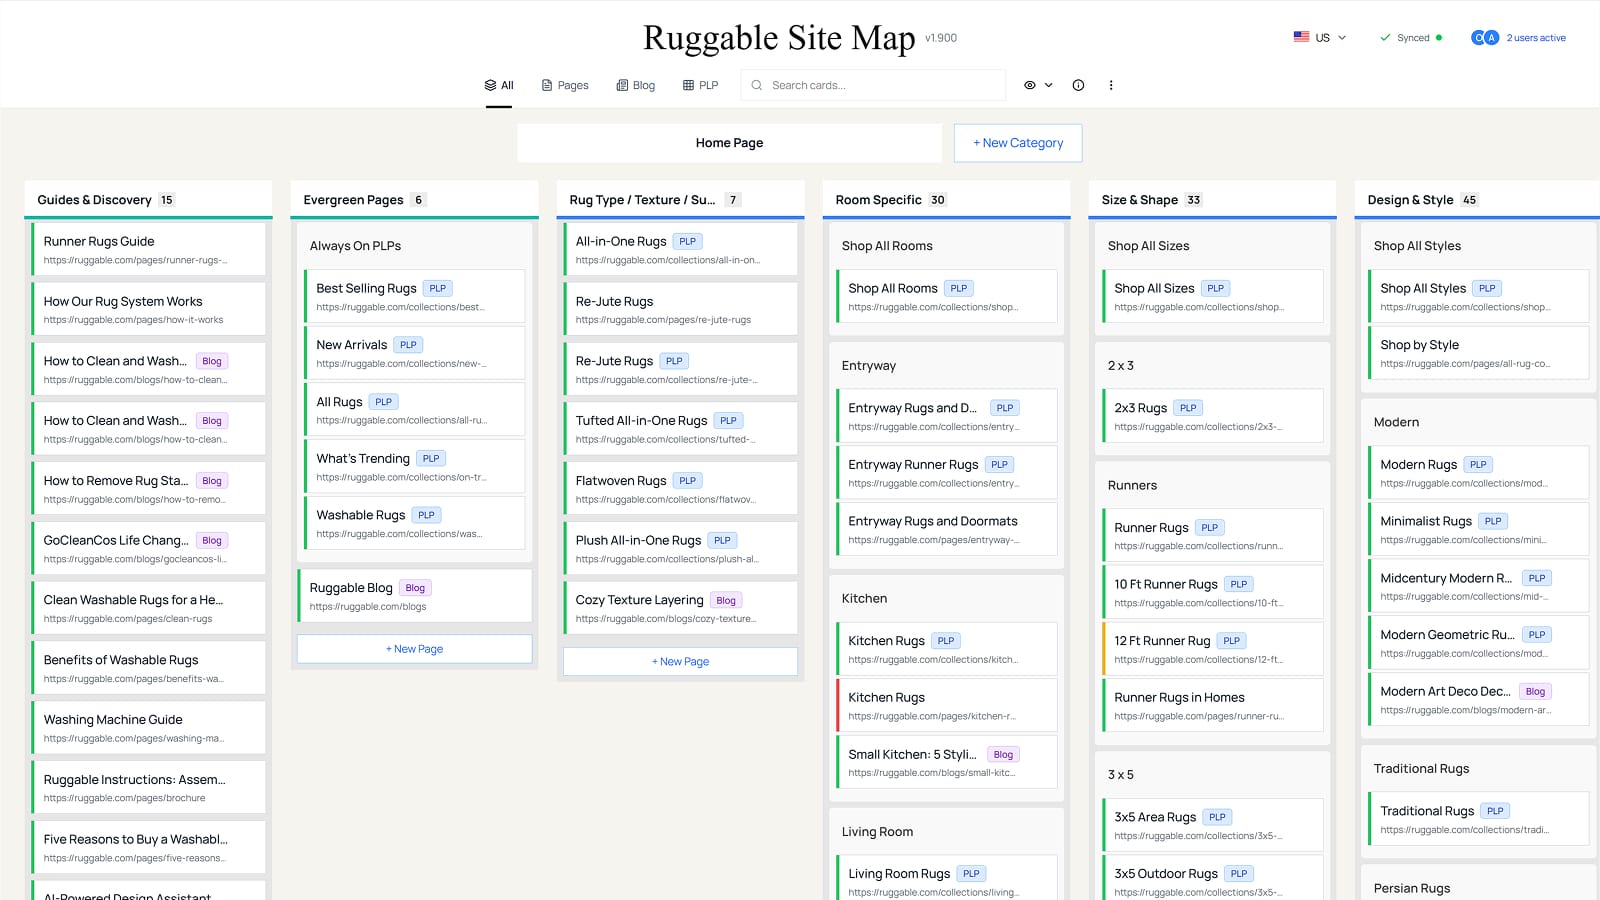
▢▢
Card hierarchy
Homepage card at the top, categories in columns underneath, subcategories nested in, individual pages as draggable cards. Twenty-plus category colors so the structure reads at a glance.
↔
Drag & drop
Pages move within a category, between categories, between subcategories. Categories themselves can be reordered. Custom drag layer, auto-scroll near the edges, drop zones that show where a card will land.
●
Status & SEO
Each card carries indexability state and a hover tooltip with URL, monthly searches, SEO clicks, backlinks, country tags, and free-form notes. The data the team needed moved out of a separate sheet and onto the card itself.
⌕
Filters & search
Switch between All, Pages, Blog Posts, and PLPs. Toggle non-indexable pages, removed cards, and empty categories. Search across every title and URL on the page.
+
CRUD with safety
Add, edit, and delete categories, subcategories, and pages, each with a confirmation modal before anything irreversible happens. Page details cover title, URL, status, searches, clicks, backlinks, notes, type, and country tags.
⌖
Regions
US and UK datasets live in separate Supabase databases with their own Realtime channels, their own version history, and their own URL routes. Editing UK doesn't touch US, and there's no way to confuse the two.
Page indexability, at a glance
The status badge on each card is the single most-consulted piece of data on the page.
Four states, color-coded, the same vocabulary across both regions.
Indexable
Live, crawlable, contributing to organic.
Non-Indexable
Live but blocked from indexing. Hidden in default view unless toggled on.
Redirected
Forwards to another URL. Kept on the map so the redirect is visible, not orphaned.
Canonicalized
Points to a canonical elsewhere. Useful for spotting duplicate-content patterns.
05 · Multiplayer
Figma-style, because the team would use it Figma-style.
Multiple stakeholders meant multiple people editing at the same time. The patterns to
borrow were obvious — auto-save, presence, version history, conflict prevention — so
I borrowed them. Realtime channels carry sync events back through Supabase. Auto-save
fires one second after editing stops. Version history captures both the auto-saves
and explicit manual save points, with who-made-what and one-click revert. Presence
indicators show who's looking.
Synced
All edits persisted, peers up to date.
Saving…
Auto-save in flight after last edit.
Error
Connection dropped. Manual retry button surfaces.
The version history was the piece I cared about most. Reorganizing a sitemap is
destructive by nature — every drag changes someone's mental model of where a page
lives. The team needed to be able to try a structure, look at it, and undo it without
ceremony. The history panel filters between all versions and manual-save checkpoints,
tracks reverts back to their source version, and lets a stale state get restored with
one click. Conflict prevention compares timestamps so an editor's own changes don't
come back at them through the Realtime echo.
Dev mode
Production and dev mode each get their own isolated database, their own edge
functions, and their own Realtime channels. Toggle dev on, experiment, toggle off.
The team's real data never gets touched by anything in flight.
06 · What shipped
Adopted. Praised. Still running.
The tool launched as a small internal request and got adopted by the team that asked
for it. Leadership pulled it into broader planning conversations. The US side shipped
into active use; the UK side I built and shipped ready-to-go, but the team was still
pulling its own data together when I left, so I never got to see the UK version in
production. The piece I didn't expect: the US side is still running after my
departure. Nobody asked me to maintain it. Nobody asked me to hand it off. It just
kept running, because Figma Make and Supabase did the part that would have needed an
engineer otherwise, and the team that asked for the tool stuck around to use it.
07 · Reflection
What building solo with AI taught me.
What worked
The scope was the deliverable.
The request from leadership was a sentence. The work was deciding what "visualize the pages" actually meant and stopping at the parts that earned their keep. Multi-user, version history, and US/UK separation were the ones that earned it. Everything else was easier to leave out than to put in.
What I'd change
A real eng security review.
The build was on initiative. I saw a problem the team had, scoped the tool, and shipped it. It worked, the team adopted it, and it kept running. What I'd ask for now is a security pass from an engineer: auth flow, edge-function permissions, Realtime channel boundaries. Not because something is wrong, but because a tool that outlives the person who built it deserves more than one set of eyes on the parts that matter.
Open question
Where else does designer-built tooling belong?
Internal tools are a big category for a reason: every team has one, every team's is brittle, and no eng team prioritizes them. AI-built tooling moves design-IC work into the gap. The question is which problems are right for this approach and which still need real engineering. I have a starting list. I don't have a clean answer yet.
What's next
The tool outlived me.
The team that asked for it still uses the US side. That's the metric I'd ask of every internal tool I build going forward: did it stay useful after I stopped touching it. For this one, the answer was yes.